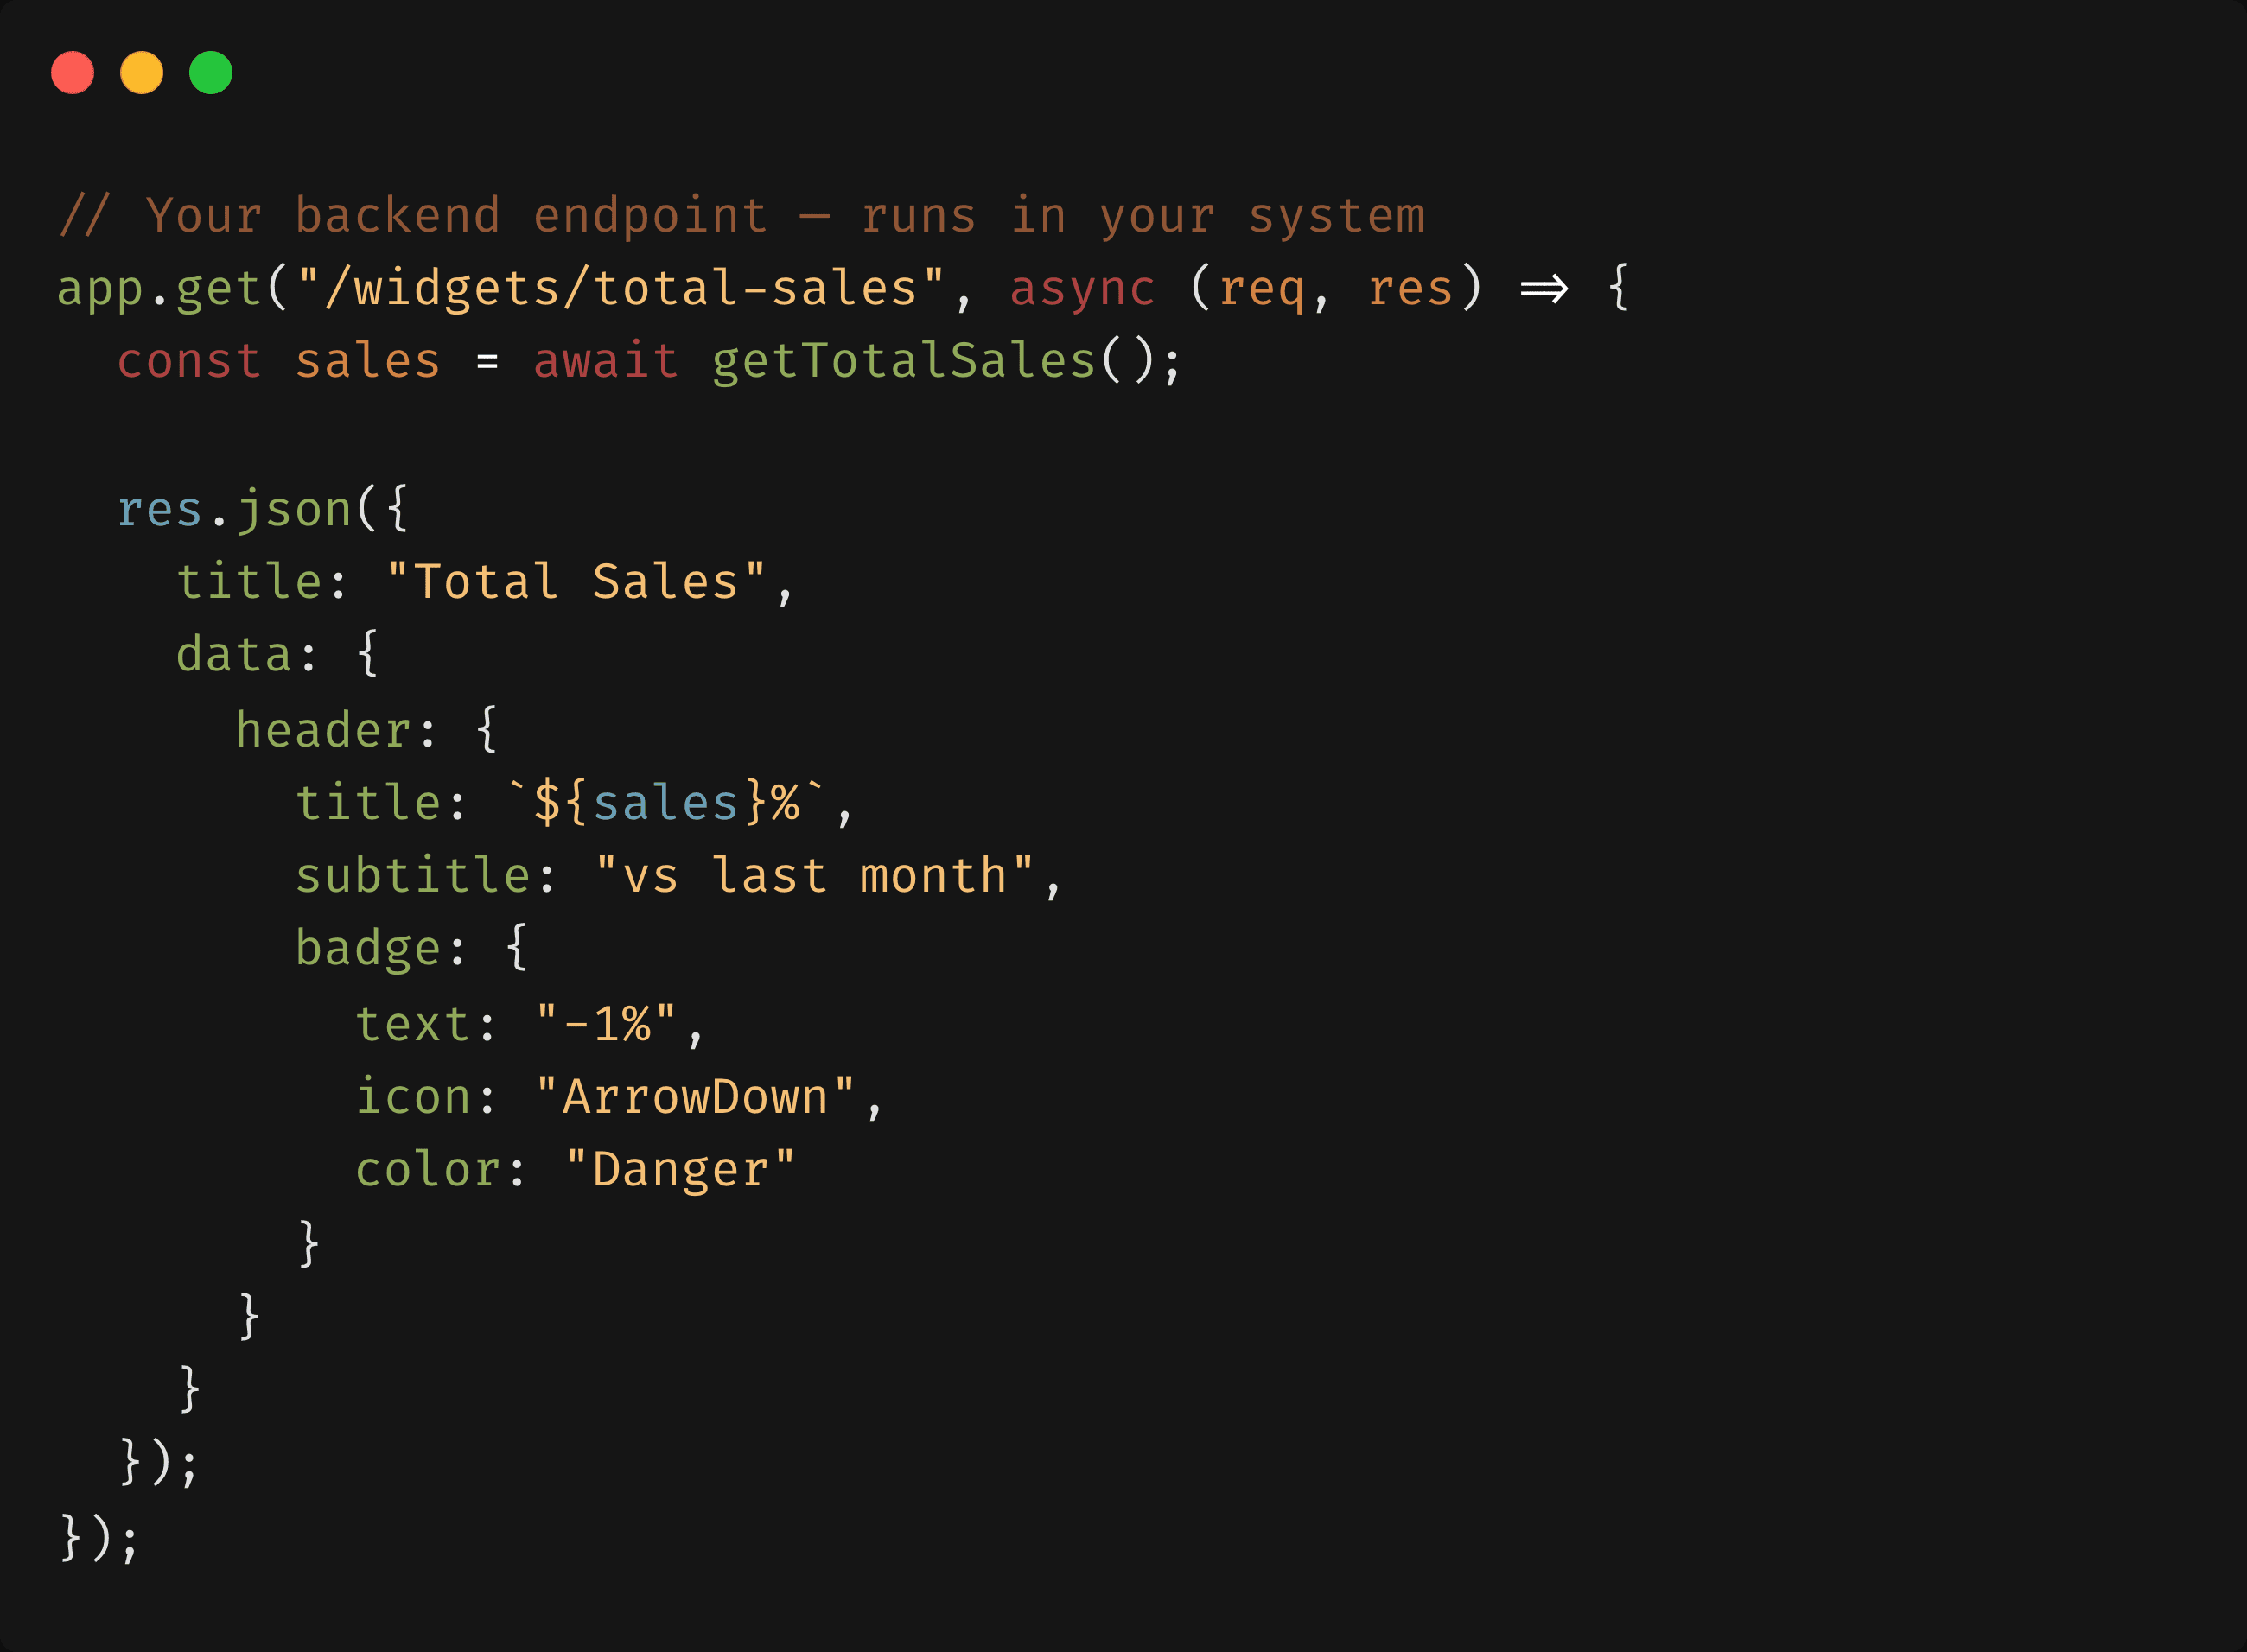
You have a Node backend. Add one route that returns a specific JSON shape, paste the URL in, and it renders as a widget.
Setup is a res.json() call and about thirty seconds in the widget editor.
The reality
Let's be honest about who's reading this: you could build the dashboard. You know React, you've used a chart library, and the first version would take an afternoon.
That afternoon isn't the cost. The cost is everything that arrives after it — the chart library's next major version and its renamed config keys, an auth layer the first time someone outside the team needs a look, a responsive pass when it gets opened on a phone, a build pipeline, a host, and a dependency graph that needs attention whether or not the dashboard changed.
None of that work teaches you anything or differentiates your product. It's just yours now.
The trade this page proposes is narrow: keep the part where your knowledge is irreplaceable — the query, the aggregation, the rule that decides what counts — and stop owning the part that draws rectangles.
Your data stays in your Node services
dashboardbase never asks for database credentials and never stores your data. It calls your endpoint over HTTPS and renders what comes back.
Your connection string, your Prisma client, your Redis instance, your internal service tokens — none of it leaves your infrastructure. There is nothing on our side that could query your database, because nothing on our side knows how.
That also means your existing middleware still applies. If a query is already scoped to a tenant by the same helper every other route uses, the dashboard route is scoped too. You're not re-implementing authorization inside a reporting tool's permission model.
Define Node.js endpoints
Each widget is one route returning one JSON object. Here's a status widget in heartbeat mode — a live pulse rather than a plain indicator:
title and data are required; actions and the optional alert object are there when you want them. That's the entire Express app:
That's a runnable file. Deploy it, paste https://your-api/dashboard/api-health into a Status widget, and you have the first tile.
That x-dashboardbase-secret header is the workspace endpoint secret. Every workspace has one, and dashboardbase sends it on every request to your endpoints automatically — there is nothing to configure beyond checking it. It authenticates us to you; it is not an API key for calling dashboardbase. Rotating it keeps the previous value working for 24 hours.
Fastify is the same handler with a different signature:
In NestJS it's a controller method returning the same object — put the secret check in a guard and every dashboard route inherits it.
Charts use the same envelope with labels and datasets inside data, where each data point is an object with a value.
Generate Node.js endpoints faster
You don't have to write these by hand.
The dashboardbase Skill is free and open source. Drop it into Claude Code, Cursor or any skills-capable agent and it teaches the whole contract — envelope, every widget schema, auth, webhook events — so the agent scaffolds a correctly-shaped Express or NestJS route instead of inventing JSON that nearly fits.
In-app prompt generation covers everyone else. The widget editor produces a copy-pasteable prompt — per widget, or one covering a whole dashboard — for whatever AI tool you already use.
Both hand you a reviewable draft you run yourself. The prompt is generated in your browser; nothing runs on our side.
Then check the result in the endpoint validator — paste a response, find out whether the widget renders it. No account required, so you can confirm the shape before signing up for anything.
Where this isn't the right fit
The dashboard is your product. A customer-facing analytics page belongs in your own app. Build it.
You need write actions. Approving refunds, editing records, triggering jobs — that's an internal-tools problem and Retool is built for it. These dashboards are read-only on purpose.
The question changes daily. No drag-and-drop query builder here. Exploration belongs in a BI tool; this renders numbers you've already decided to watch.
Infrastructure metrics. Event-loop lag, heap usage, p99 by pod — Prometheus and Grafana do that properly. Use this for the business numbers they were never meant to hold.
Point it at one route and see
Add the handler above to a service you already run, paste the URL into a widget, and judge it from something real. The next widget is another fifteen lines, and the whole board reads on your phone in the native iOS and Android apps.
Worth reading next: why building dashboards yourself is more work than you think for the ownership maths, and how to build a dashboard if you're still weighing all three routes.